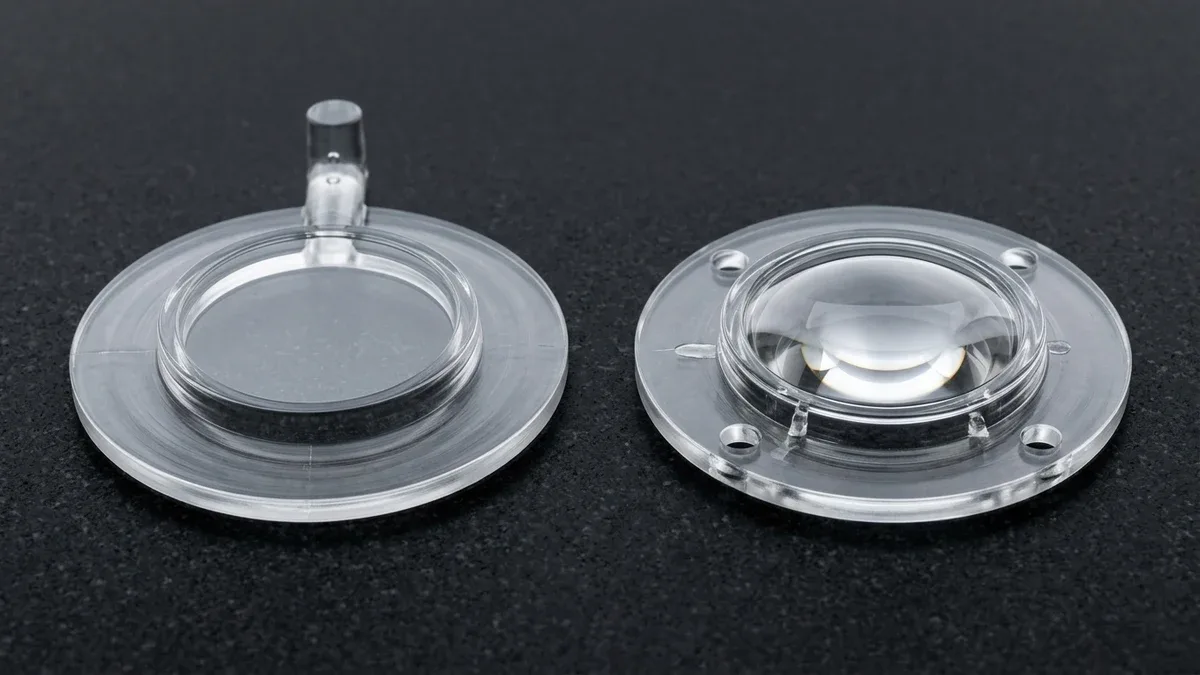
Conducting comprehensive mold flow analysis serves as an indispensable engineering prerequisite for production tooling design. Consequently, simulating polymer thermodynamics before cutting hardened tool steel eliminates costly tool modifications and unexpected scrap rates.
Modern product development demands zero-defect execution during plastic part scale-up. Furthermore, deploying advanced injection molding simulation tools ensures balanced melt delivery across complex multi-cavity layouts.
Before committing to production mold tooling, product teams frequently validate part form using polyurethane vacuum casting. However, scaling to high-pressure injection molding requires rigorous finite element flow verification.
Executive Summary & Engineering Takeaways (BLUF)
- Core Focus & DFM Scope: Actionable shop-floor engineering guidelines for Mold Flow Analysis, covering material selection, geometric tolerancing, and defect prevention.
- Dimensional Tolerance Baseline: General molded/cast features hold ISO 2768-mK or ±0.05 to ±0.10 mm (±0.002″ to ±0.004″); critical post-machined datum bores achieve ±0.010 mm (±0.0004″).
- Tooling & Surface Integrity: Cavity surfaces finished from SPI A-2 mirror polish (Ra 0.05 µm / 2 µin) to VDI 3400 spark-eroded textures with mandatory 1.0°–2.5° draft angle compensation.
- Metrology & Flow Validation: Pre-tooling DFM and rheological fill simulation paired with Zeiss CMM first-article inspection (FAI) and wall-thickness ultrasonic/section verification.
- Ex-Factory Turnaround: 7 to 12 business days for vacuum cast/urethane bridge batches; 18 to 35 business days for rapid aluminum/P20/H13 tooling and T1 sample delivery (excluding 3–5 days air transit).
Article Engineering Navigation
1. What Is Mold Flow Analysis?
Mold flow analysis utilizes numerical fluid mechanics to simulate thermoplastic flow inside an injection mold cavity. Specifically, the simulation software models non-Newtonian viscosity, heat transfer, and phase transitions.
During analysis, virtual polymers fill cavity meshes under precise pressure and thermal profiles. Therefore, tooling engineers accurately predict fill times, shear rates, and clamping tonnage requirements.
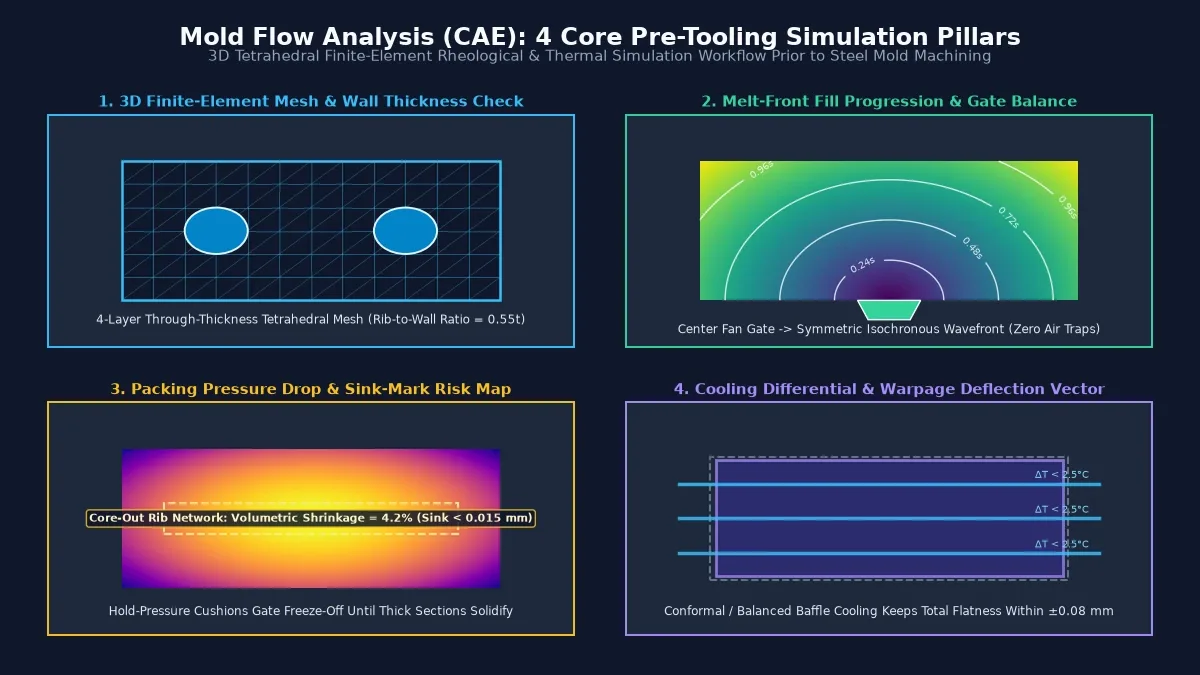
Early flow simulation prevents devastating tooling rework after steel machining. Additionally, running iterative simulations optimizes wall thicknesses and gate placements prior to tool construction.
2. Key Mold Flow Simulation Parameters
Engineers evaluate several thermo-mechanical indicators to verify mold fill feasibility. To illustrate, review the critical simulation parameters below:
| Simulation Parameter | Unit / Metric | Engineering Significance | Tooling & Process Action |
|---|---|---|---|
| Fill Time | Seconds (s) | Indicates melt front speed and flow balance | Adjust runner cross-sections and gate diameters |
| Injection Pressure | MPa / Bar | Monitors maximum machine barrel pressure limits | Enlarge thin wall sections to avoid pressure spikes |
| Bulk Melt Temperature | Degrees Celsius (°C) | Tracks thermal degradation or freeze-off | Optimize conformal cooling channels in mold core |
| Volumetric Shrinkage | Percentage (%) | Governs sink mark severity and part density | Increase packing profile pressure and hold time |
| Clamp Force Tonnage | Metric Tons | Determines molding machine size compatibility | Select matching molding machine tonnage |
| Deflection / Warpage | Millimeters (mm) | Predicts post-ejection geometric deformation | Balance cooling rates and add structural ribs |
3. Core Defect Prevention Mechanisms
Mold flow analysis isolates root causes of manufacturing flaws before cutting mold steel. Specifically, simulation identifies four critical defect categories.
1. Gate Optimization and Balanced Filling
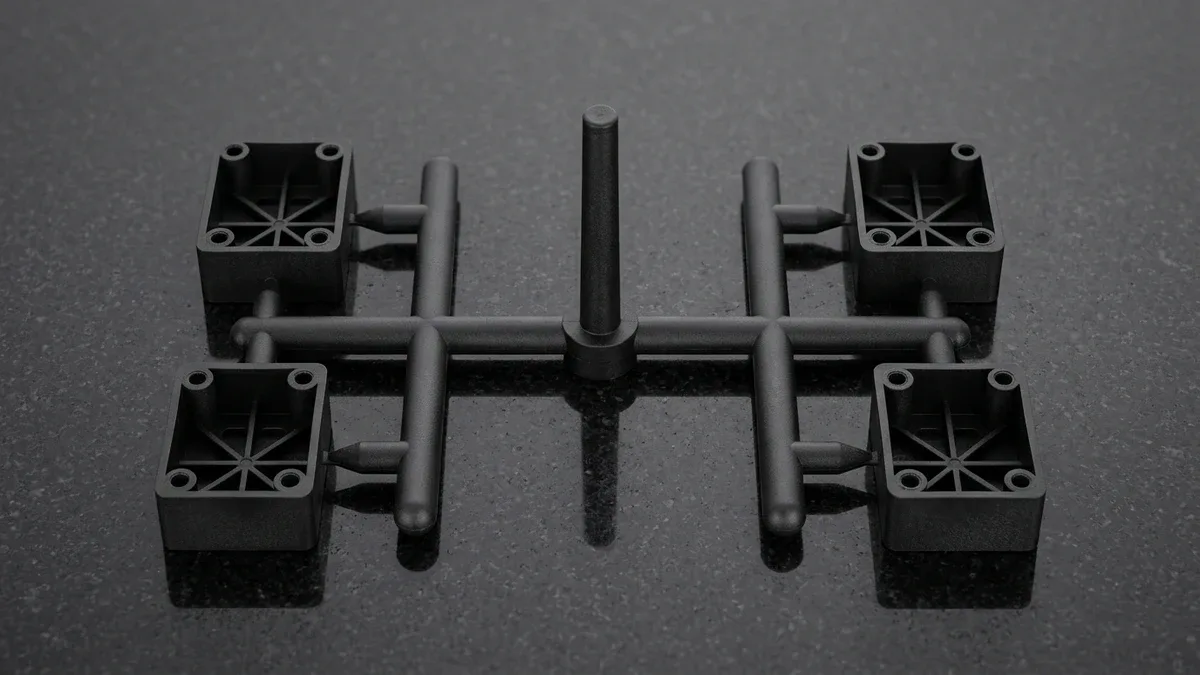
Improper gate placement causes uneven flow paths and premature localized freezing. Consequently, distant cavity features suffer from short shots and severe internal stress.
Moldflow software calculates optimal gate positions by analyzing geometric volume centers. Therefore, molten plastic reaches outer part perimeters simultaneously under balanced pressure.
2. Weld Line Mitigation
Weld lines occur when two advancing melt fronts collide around holes or core pins. For example, cold melt fronts form weak structural joints that fracture under minor impact.
Simulation maps precise weld line coordinates and interface temperatures. Hence, engineers adjust gate locations to relocate weld lines into non-cosmetic, low-stress zones.
3. Air Trap and Burn Mark Elimination
Converging melt streams can trap pocketed air within unvented mold pockets. Consequently, adiabatic compression ignites trapped air and burns surrounding plastic resin.
Mold flow analysis pinpoints the exact locations of trapped gas pockets. Thus, mold makers install precision porous vents or parting-line vents before testing.
4. Injection Molding Defects Prevented by Moldflow
Proactive simulation resolves tooling issues that traditional physical trial-and-error cannot easily remedy. To illustrate, review the defect mitigation breakdown below:
| Molding Defect | Root Cause Detected in Simulation | Tooling Modification | Process Parameter Adjustment |
|---|---|---|---|
| Short Shots | Excessive flow length or inadequate pressure | Enlarge gates and thicken restrictive ribs | Increase injection speed and barrel temperature |
| Sink Marks | Excessive localized volumetric shrinkage | Reduce rib thickness to 60% of nominal wall | Extend hold pressure duration |
| Part Warpage | Asymmetrical cooling and differential shrinkage | Redesign cooling loops for uniform heat removal | Balance mold core and cavity temperatures |
| Air Traps | Unvented pocket at last point of fill | Machine 0.02 mm gas vents or ejector pin vents | Slow injection velocity near end of fill |
| Tool Flash | Cavity pressure exceeding machine clamping force | Add tool shut-off preload lands | Transfer to higher clamp tonnage press |
5. Why Do Molded & Die-Cast Parts Experience Dimensional Warpage or Flash, and How Do You Prevent It?
Managing Mold Flow Analysis successfully requires balancing volumetric shrinkage, cavity clamping pressure, and thermal dissipation across uneven wall cross-sections. While uniform walls of 1.5 to 3.0 mm (0.060″ to 0.118″) stabilize flow fronts within ±0.05 mm (±0.002″), abrupt rib-to-wall transitions exceeding a 0.6:1 ratio induce localized sink marks, internal voids, and residual warpage.
Shop-Floor Quantitative Derivation: Clamping Force, Shrinkage & Thermal Cooling Balance
In our Shenzhen tooling and molding engineering practice, preventing parting-line flash and dimensional drift in Mold Flow Analysis starts with exact clamping tonnage and linear shrinkage compensation before steel or aluminum blocks are cut. Consider a structural housing with a projected cavity area Aproj = 140 cm² (21.7 in²) molded at an internal cavity pressure Pcav = 45 MPa (6,525 psi):
Fclamp = Aproj × Pcav × Sf = 140 cm² × 0.45 tonnes/cm² × 1.20 = 75.6 tonnes (83.3 US tons)
Simultaneously, tooling cavity dimensions (Dcavity) must compensate for isotropic or anisotropic material shrinkage (S).
For a nominal 120.00 mm (4.7244″) datum spacing with a semi-crystalline or alloy shrinkage factor of S = 1.6% (0.016 mm/mm), the machined cavity steel dimension is calculated as Dcavity = Dnom × (1 + S) = 120.00 × 1.016 = 121.92 mm (4.8000″). To lock critical bearing bores or sealing faces within ±0.010 mm (±0.0004″), we leave a 0.40 mm (0.016″) stock allowance for post-molding 3-axis and 4-axis CNC finish milling.
Step-by-Step Shop-Floor Execution & Quality Protocol
To bridge CAD intent with repeatable shop-floor delivery, our engineering team enforces a four-stage execution workflow across every prototype and low-volume production batch:
- Step 1: Rheological Flow & Wall-Thickness DFM Audit: Analyze 3D CAD geometry (STEP/IGES) to verify uniform wall sections, apply 1.0° to 2.5° draft angles per VDI 3400 / SPI texture depth, and position gates away from cosmetic or high-stress zones.
- Step 2: Precision Cavity Machining & Venting Calibration: Machine P20, H13, S136, or 7075-T651 tooling inserts via high-speed CNC milling and Wire/Sinker EDM, grinding perimeter gas vents to 0.015–0.030 mm (0.0006″–0.0012″) depth to evacuate trapped air without flash.
- Step 3: Thermal Stabilization & Scientific Process Windowing: Stabilize mold tool temperature via turbulent conformal/baffle cooling channels (Reynolds number Re > 4,000) and decouple fill, pack, and hold stages to eliminate weld lines and internal porosity.
- Step 4: T1 First-Article Zeiss CMM & Section Verification: Inspect T1 shots after 24-hour thermal conditioning at 20°C (68°F) using Zeiss CMM probing and optical comparator overlays against ISO 2768-mK and drawing GD&T callouts.
Shop-Floor Defect Troubleshooting & Corrective Action Matrix
When evaluating part geometry during pre-production DFM review, our manufacturing engineers screen for the following failure modes and apply proven corrective controls:
| Defect / Symptom | Physical Root Cause | Shop-Floor Corrective Action | Recommended DFM Spec Limit |
|---|---|---|---|
| Parting-Line Flash / Burrs | Insufficient clamp tonnage, excessive injection velocity, or vent depth exceeding 0.04 mm (0.0016″) | Increase clamp safety factor to 1.25×, switch from velocity-to-pressure transfer at 98% fill, and lap parting faces to ≤0.010 mm (≤0.0004″) shutoff. | Flash ≤ 0.05 mm (0.002″) |
| Localized Sink Marks & Voids | Rib-to-wall thickness ratio exceeding 60% causing core thermal contraction after skin freeze | Coring out thick bosses, reducing rib root thickness to 50%–60% of nominal wall, and extending packing pressure until gate freeze-off. | Rib root = 0.5–0.6 × twall |
| Flow Weld / Knit Line Weakness | Converging melt/flow fronts cooling below fusion threshold around cored holes or inserts | Raise melt and mold surface temperatures by 15°C–25°C (27°F–45°F), add overflow wells at knit zones, and relocate gate entry vectors. | Tensile retention ≥ 85% |
| Post-Ejection Warpage & Twist | Differential cooling across asymmetric cavity halves or fiber orientation anisotropy | Balance core/cavity coolant delta within ΔT ≤ 5°C (9°F), anneal stressed parts in precision cooling jigs, and post-machine critical datums. | Flatness ≤ 0.10 mm / 100 mm |
Engineering Trade-Offs: When NOT to Over-Specify
When to Avoid This Process (Engineering Limitations): Do not specify dedicated hard tooling or molding workflows when unit quantities are under 10 pieces and the design geometry is still undergoing weekly functional revisions. In early-stage validation where upfront tooling amortization and 18 to 35 business days of tool fabrication delay testing, direct high-speed 3-axis and 4-axis CNC machining from solid engineering billet or polyurethane vacuum casting (4 to 12 business days ex-factory) delivers superior agility with zero steel modification risk.
🔗 Related Tooling & Molding Engineering Benchmarks:
Optimizing Mold Flow Analysis requires coordinating cavity thermal management, surface texture draft angles, and bridge production pathways. Explore our in-depth guides on Conformal Cooling vs. Conventional Cooling Channels to cut cycle times by 20%–35%, Preventing Flow Marks & Cosmetic Molding Defects, and Polyurethane Vacuum Casting for 10–50 Unit Bridge Runs.
6. Technical Engineering FAQ
Mold flow analysis is a finite element computer simulation of the injection molding cycle. It calculates melt filling patterns, injection pressures, cooling rates, and post-molding warpage before steel tool cutting begins. At AS Prototypes, our engineering team validates these parameters against ISO 2768-mK general tolerances (or ±0.05 to ±0.10 mm for precision molded features, with post-machined datums held to ±0.010 mm / ±0.0004″) and provides 24-hour DFM feedback.
Simulation should be conducted immediately following initial part design freeze and before final tooling release. Consequently, engineers can modify nominal wall thicknesses, balance runner drop geometry, and optimize gate locations without costly steel retooling.
The simulation models volumetric shrinkage and thermal cooling gradients across every section. Thus, engineers identify thick geometry intersections, adjust rib-to-wall proportions to 50%–60%, and optimize turbulent cooling circuits to maintain uniform shrinkage across the part.
Transition Seamlessly from Rapid Tooling to High-Precision Molding
Optimize cavity life, gate geometry, and part unit economics with our in-house tooling and injection molding engineering team. Upload your 3D CAD models (STEP/IGES) for a comprehensive Moldflow and DFM manufacturability assessment.
Upload 3D CAD for Tooling & Molding DFM Review